DSP-10 User's Manual V396
Transceiver Operation
This Chapter covers user information about the general operation of the
DSP-10.
SSB
Operation
Let's start a tour of the DSP10 operation by
looking at
receiving
and
transmitting a SSB signal. We assume that you have gotten the hardware
working, that it is properly connected , and have the software loaded.
So the DSP10 screen should be displayed and the clock in the lower left
corner should be updating. We'll also assume that you are using the
default settings for the UHFA.CFG Configuration File , at least as a
start.
USB is the default mode and should be indicated on the screen. If not,
use ALT-M mode selection to bring up the Mode to USB, the standard
sideband for VHF operation. If this mode is is not available check the
configuration file variable, mode_mask
.
SSB Frequency - The
frequency can be set by the F9 and F10 keys,
along
with the modifiers CTRL, ALT and SHIFT. The display is the transmit
frequency for zero audio frequency, meaning that the upper sideband
extends from this frequency upward by about 3 kHz. You can also change
the receive frequency with RIT . This does not change the indicated
frequency, since the displayed frequency is the transmit frequency.
Audio Settings
Now, if the audio gain is turned up, you are ready to receive signals.
This is a good time to explore the use of the cursor keys to change
frequency and audio gain. The left and right cursor keys should lower
and raise the frequency by 50 Hz. These same keys, along with the SHIFT
key will change the frequency by 1 kHz. Most people find this makes a
tuning arrangement that rivals a knob! If the tuning steps are not what
you want, they can be altered in
value . Additionally, the audio gain
can be changed by the up/down arrows. The default values are 2 dB (10
dB with shift) but they can also be altered. Try "Page Down" key; it
mutes the audio on and off.
A variety of audio filters are
available for reception. This includes
the ability to design a custom filter to suit your desires.
Transmit SSB - Transmitting USB requires having the microphone
connected, of course. Additionally, the push-to-talk comes in two
styles. The default is all software and serial link controlled. This
introduces an annoying delay, but works fine. You will want to install
the hardware PTT
connection to the PC; this goes through the same
serial cable, but does require minor changes to the EZ-KIT Lite wiring.
You can also always use the "Home" key to toggle transmit and receive
(be sure that the SCRL Lock is off!).
There are three interacting controls for the audio level. The hardware
audio gain should be set first. If a 'scope is available, look at the
audio level on the line ADC_L, which may be most accessible at the
feed-through capacitor C216.The hardware gain should be set so that the
level never exceeds 1 Volt, peak-to-peak, using your normal speech
level. Alternatively, watch the D/A level bar graph (SCRL F3) and be
sure the last bar does not light, but the next to right one does on
peaks.
Next, using the CW or FM modes, set the "Xmit Pwr, SCRL-O and SCRL-P,
for the desired output to drive the following transverter or amplifier.
A power indicator, such as the diode detector in Fig 12 of the October
1999 QST article may be helpful for this experimentation.
If the resulting setting is above 95, it is best to reduce the power
level to 95. Failure to do so will result in a warning message,
"W17 Excess Pwr." Two problems can result. First, the RF
amplifiers are being challenged for ouput, and gain compression may
cause splatter. The exact point of concern here may vary from one
radio to another, but Xmit Pwr=95 should be a safe point. In
addition, the clipping and filtering used needs a fraction of a dB
for overshoot in the filter, and a setting of 100 does not allow
that, whereas 99 does..
Next, return to USB or LSB, and adjust the mike gain by watching
the clipping level on the left side, and keep the clipping to around 0
to 6 dB. The maximum clipping is 12 dB, and exceeding this level
can cause splatter.
On-the-air tests will be the final test of this level to be sure that
you are not over-driving either the DSP10 or any follow-on amplifiers.
Other improvement that can come from over-the-air tests using the
transmit
microphone equalizer.
CW Operation
CW operation starts with selection of CW (or as we can explore later,
LTI) modes. ALT-M goes through all modes allowed by the variable
mode_mask
in the Configuration
File . The CW mode cannot be masked, and is always available.
CW Keying - A CW key can be plugged into
the DSP-10. This is
not a paddle, but just a simple straight key.Alternatively, the
right-hand
ALT key can be used as a straight key. Not all keyboards have that ALT
key, however. For those not wanting to use a key, CW can be sent
directly from the keyboard. This can be typed in while in either
Transmit or Receive. It will not be sent unless in Transmit. Most
punctuation marks are available, as well as some of the specialized
symbols, such as AR and SK. These are listed in the CW section of the
Keyboard Commands .
Capital and lower-case letters are treated
identically.
Up to10 CW messages can be saved in the UHFA.CFG for
loading to the CW transmit buffer.. CTRL-ALT-SHIFT-3 will place the
following message in the transmit buffer. If the DSP-10 is in transmit,
the message will be sent immediately. If not in transmit, it will wait
until transmit is started.
cwmsg 3 |@%CQ CQ DE W7SZ W7SZ W7SZ [ K!|
Seven special control characters are available in CW, but may be
particularly useful embedded into a
message, as follows:
# first and last elements of a looped meassage
@ breaks any #...# loop that may be active.
% clears the CW sending buffer, immediately
~ a programmable length" key down" default value is 10
(seconds)
{ key down one second
} key up one second (kinda like a space)
! Takes the radio out of Transmit and places it into
Receive.
Thus, for instance, a CQ message might be:
cwmsg 3 |@%CQ CQ DE W7SZ W7SZ W7SZ [ K!|
This would first clear any loop and the transmit buffer. (this is
generally a good way to start any precanned message; it is ignored if
no loop is running). Next the CQ message is sent, followed by '[' for
AR and a 'K'. Finally the radio is put into receive with a '!'. That's
it the message has been sent.
If we want to have a message that can be repeated by the home key we
can add # to the begining and end of the message
cwmsg 1 |@%# CQ CQ DE W7SZ W7SZ W7SZ [ K!#|
Now the message wants to loop between the two #'s forever, except we
sent the machine to receive with the !. All that's needed to send this
again, is to hit the HOME key. If we need to type a message from the
keyboard, we must first clear the transmit buffer by SHIFT-DELETE, else
the message will send every time we try to transmit.. Running this
message with the BCN on will cause the DSP-10 to switch bqack to
receive momentarily, then send the message again.. No harm comes of
this, but it seems silly. Use of the @ and % is highly recommended
unless you have no more than one "canned" message.
There are many ways to use the transmit message buffer and the "beacon"
T/R together.
If you want to call a CQ every now and then, find the length of time
needed to call a CQ.. if this is 15 seconds for instance, and we want
to listen for 30 seconds after the CQ then......... set the times in
SCRL F2 to 15, 30, 0 and move the canned message to the transmit
buffer.Beacon TRANSMIT is initiated with ALT H, NOT the HOME key
cwmsg 4 |@%cq cq cq de kd7ts cn87 #|
15 and 30 seconds do not add up to an even submultiple of an hour, so
each CQ will be sent in a different part of each minute.
Beacon timing can be saved in a memory
that you create for this
particular use. The message is stored in UHFA.CFG.
Another use is for filling air time with "key down" and an ID
every minute. By timing the ID length -- SPACE call SPACE, we can
determine how long we can hold the key down. If the call and two spaces
take 7 seconds, then we can change the (tilde) in UHFA.CFG to 53
(cw_longkey 53). These are the ingredients for a one minute loop.
cwmsg 5 |@%#~ kd7ts #|
This will repeat forever ! To complete this we use the "beacon" T/R set
for five minute transmit and five minute receive. In the SCRL F2 dialog
box we put in 300, 300,0. This tells the DSP-10 to transmit for 300
seconds ( five minutes) starting at 0, 10, 20, 30, 40, 50 minutes and
switch to receive at 5 15 25 35 45 55 minutes. Beacon TRANSMIT is
initiated with ALT H, NOT the HOME key.
CW Sidetone and Offset - In the CW mode there are several
special
display items. Between the "Mode" and "CW" on the left there are two
numbers in beige. The first is the side-tone level that is adjustable
by Scrl S and Scrl D commands. This ranges from 0 to 100. The second
number is the CW offset value. This is the frequency shift that occurs
between transmit and receive. The displayed frequency is the actual
transmit frequency. In CW the receive "zero-beat" frequency is lower by
the CW-offset and reception is in USB. The CW-offset is set by the Scrl
C and Scrl V commands. In addition, at the bottom of the spectral
display there is a small red line that shows the CW-offset. If the
received signal is lined up with this mark you will be transmitting on
the same frequency as the one you are receiving. Most often, you will
want the CW-offset to be the same as the center frequency of the audio
filters.
While on the subject of CW, the side-tone frequency tracks the CW
Offset. If the pitch being received is the same as that of the
side-tone, you will be transmitting on the same frequency as the
station being received. The side-tone is only available in the right
speaker since the left side D/A is being used for the transmit I-F.
CW Speed - The "CW Speed" applies only to transmit. There is no
automatic CW reception implemented. The CW speed weighting is standard
1-3-5 for the higher speeds and gradually changes to faster characters
and longer spaces for speeds below about 13 WPM. For those desiring to
play with such things, all the weighting and speeds are programmable by
recompiling the program. Presently the speeds for conventional CW are 5
to 75 WPM, in various sized steps. In addition, to support experiments
in Very Slow CW, speeds of 0.5 and 1 WPM are available. These are
normally read by watching a spectral waterfall.
Transmit/Receive - Transmit/Receive toggling is most easily
done with
the HOME key (be sure that SCRL-Lock is off). However, the PTT
connection from the microphone is active. The transmit audio is, of
course, turned off.
A variety of audio filters
are availables for reception.
FM Operation
FM operation with the DSP-10 is very parallel to commercial radios.
This supports NBFM, has a squelch and a few "channels" which are
referred to as Memories, which include FM offsets and associated tones.
No scanning provision is included. Mode selection is done with the
ALT-M key combination. Be sure that the mode_mask has been set to
include FM (an 8 in the sum).
FM Frequencies - FM frequencies tune in even 5 kHz steps. The
tuning
controls using the F9 and F10 keys will only allow 5 kHz or larger
steps; any step less than 5 kHz will shift at the larger resolution.
The display is only to 1 kHz resolution. RIT settings are not used in
FM, although they continue to appear.
For channelized operation, any VFO or Memory may be used. VFOs
remember the last saved frequency and mode, along with the FM offset,
and FM tone data. Memories will return to the preset frequency
and mode, as well as almost any DSP-10 configuration, if needed.
FM Audio
There is a separate gain control for FM that comes and goes with that
mode. The mute will pick up the wrong AF gain if you change into or out
of FM while muted.
VFO Operation - There are 20 VFOs available. Each of these is
recorded
in the UHFA.CFG
configuration file For simplex operation, the
definition of a VFO requires no editing of the configuration file. For
example, operation on 146.52 using VFO 3 would be set up by selecting
that VFO, with Ctrl-Alt-D (A is 0, B is 1, etc.), selecting the FM
mode, and tuning the radio to 146.520 MHz. Using any other VFO or
memory will not alter VFO 3. Examining the configuration file will show
a line:
vfo 3 1 0 146520000.0 3 2 0.0 0 0 0 0 0
One need not try to decipher all the details of this line, but the vfo
number is the second entry, next is a 1 corresponding to the
transverter being used (in the DSP-10 there is always a "logical"
transverter, even if no frequency conversion is involved). The
frequency is obvious, and is in Hertz. The "3" following the frequency
is the mode, FM. Entries after the 3 may vary, as they reflect the tone
selections.
Adding to that example, suppose we returned to VFO 3 and used the
SCRL-F7 dialog box to set a 103
Hz continuous tone (CTCSS) at a
level of 90. The CTCSS is enabled by setting the tone duration in the
dialog box to 9999. Now the line in the configuration file will be
vfo 3 1 0 146520000.0 3 2 103.0 9999 90 0 0
One can verify the tone is in use by the looking for the notation
"103.0 90" just above the S-meter during transmit .
Still using VFO 3, let us set up an offset for our receive frequency of
146.94 and our transmit frequency 600 kHz lower at 146.34 MHz.. We will
leave the setting of the tone for 103 Hz CTCSS. Using F9
and F10 plus modifiers, tune the radio to 146.94 MHz. Next we must edit
the configuration file to enter the repeater offset (this will
eventually be added to a dialog box).Stop the program by ALT % (DOS
VISIT) or CTRL-ALT-F4 (QUIT) and edit the configuration file, UHFA.CFG.
with a text editor.
Find the line in the *** VFO definitions (memch_vfo) *** section
for vfo 3
vfo 3 1 0 146940000.0 3 2 103.0 9999 90 0 0
Edit this line to include a -600 kHz offset as
vfo 3 1 -600 146940000.0 3 2 103.0 9999 90 0 0
Return from the DOS visit by typing "Exit" then hit
<Enter>, or restart the program. . We now have VFO 3 with a
transmit frequency of 146.34 MHz,.
For a transmit frequency higher than the receive frequency, the offset
will be a positive number.
Memory Operation - Most FM operation is simplified by using
memories.
Let us proceed to create memory number 3494 (remember this can be any
number from 0 to 9999). We will leave the settings as they were
in the last VFO example, including the 103 Hz tone. With VFO 3 in
place, use Alt-N dialog box
to create the memory. Set the memory
number in the dialog box to 3494, the name to "FM34/94" and the
description to "146.94 FM 103 Hz CTCSS". Obviously these three choices
are arbitrary in their content. In the "check boxes" check only
"Freq and Mode" and close the box. The -600 kHz repeater
offset will be picked up from the VFO, even if the frequency is
changed. Thus, with some planning, it is possible to borrow offset
values from existing memories or VFOs. Returning to Memory 3494, this
has created a text file named UM3494.MEM. The contents are:
UHFAMEM2
cur_mem 3494
mem_name |FM34/94|
mem_descr |146.94 FM 103 Hz CTCSS|
mem_incl_fr_md 1
vfo 21 1 -600 146940000.0 3 2 103.0 9999 90 0 0
Notice that the VFO entry in the memory file has taken on a special
value, 21. This VFO is not available for use, except by invoking a
Memory. But it can be edited in the same way as any VFO. It
carries the transmit and receive frequencies, the mode, and the tone
information.
Audio Filters - All audio filtering options are available in
FM,
including Design-a-Filter, LMS Noise Reduction and Auto-Notching.
S-Meter - In FM the power indicated is very accurate in a
relative sense. It is the result of a true Root-Mean-Square (RMS)
calculation of the received Signal-plus-Noise. The absolute
accuracy can be good, as well, if a reference generator is available.
This is adjusted by the gain factor in the transverter definition.
FM Spectral Display - In FM, the spectral display is that of the
received audio. Here (but only in the FM mode) the power at the display
marker is not meaningful, and so the S-meter is computed by a true RMS
calculation of power in the FM bandwidth. This has a high relative
accuracy and the results are shown to 0.01 dB resolution. The
absolute accuracy can be good, as well, if a reference generator is
available. This is adjusted by the gain factor in the transverter
definition. The spectral display shows a very high level when no signal
is being received. This is the FM noise that can also be heard if the
squelch is set too low. When a signal is being received, the noise will
be seen to drop in the spectral graph. This is a measure of FM
quieting. If tones, such as CTSS are being received on a signal, these
will be seen on the spectral display, and can be used to estimate the
tone frequency.
The only frequency scale available for FM is 0 to 4800 Hz. The only
windowing function available is "Hamming." These are automatically set
with the FM mode.
Frequency Measurement - FM operation includes over-the-air
frequency
measurement . This is displayed in the upper left display box. The
accuracy of this display is limited by the 10 MHz reference accuracy
and receiver noise. If a transverter is in use, the indicated frequency
will be correct, with the shift coming from the transverter definition
in the configuration file. Two forms of display are always shown, the
deviation from the center frequency, and the actual frequency.
FM Squelch - In the FM mode there is a number in beige between
the
"Mode" and "FM" on the left side. This is the squelch setting that
ranges from 0 to 100, and is set by the Alt S (or Alt s) and Alt D (or
Alt d) commands.
FM Transmission - This totally parallels the SSB
transmission, discussed above, including PTT and microphone
equalization.
HELP SCREENS
Prior to version 396, help screens come from a file,
UHELP_1.TXT. This is a text file that is displayed on the DSP-10 screen
when the help command (F1) is executed. With Version 396 the file name
is UHELP_2. TXT. This file can be edited with most standard ASCII text
editors (avoid MS Word) to customize the display. This is useful when
keyboard definitions are customized, but can be used anytime.
In the text for each screen, is a number line to help you
count the number of characters. This appears as
123456789012345678901234567890|23456789012345678901234567890123
There are 63 numbers corresponding to the 63 character limit. This line
must remain, as is, to identify the start of each screen. Additional
screens can be added by copying the "number line," followed by up to 22
lines of text. Lines longer than 63 characters, or screens of more than
22 lines will be truncated. A vertical line, "|", shows the center of
the line, and is useful for setting up two columns. The number lines,
of course, do not get shown as part of the help screens.
The Help File uses the 8-bit ASCII set, and allows accents. Either or
both the CR (13) and LF (10) are taken as end of line. Empty
lines are ignored and a blank line should include at least one space.
Do not use tabs for spacing lines.
The last screen in this file should be 8 lines, or less, allowing for
EME location data at the bottom. If more than 8 lines, the top of the
screen showing the EME locations will be blank. This is not harmful,
but also not aesthetically pleasing!
Similar instructions are included at the top of UHELP_1.TXT, and you
can add additional comments there. Comments must precede the
first "number line."
When the ALT-Y (or ALT-y) command has the large frequency slide rule
display in place, there will also be a summary help screen permanently
below the frequency dial. This has the most common commands listed. In
addition, there are three more detailed screens available that occupy
the entire lower-right part of the display. These are sequenced through
by the F1 key. When the waterfall display is in place, the Help screens
will replace the waterfall. No updating of the display will take place
while the Help screens are being seen. After about 10 seconds, data
will start to be be lost from the waterfall. This creates no problems
for the program operation, so long as the data is not critical to the
user.
Front Panels
Slide-Rule and Spectral Panels - There are two distinct "styles"
available for the front panel. The default is a large size frequency
readout with a slide-rule dial beneath. A help summary is always shown
below the frequency dial. Alternatively, a "waterfall" type of spectral
display can be shown along with a smaller frequency display. This is
useful for "seeing" weak signals. All transceiver functions are
available with either display style. The style is toggled by the Alt Y,
or Alt y, commands as listed.
Most operating parameters are shown in the "Front Panel" display along
the left side. Adjustable parameters are often shown as 0 to 100. AF
Gain, mike gain and the like are exactly 1 dB per unit. Parameters that
are toggled change to show their current state.
The upper right portion of the screen is a spectrum display calibrated
in dB. The scale is adjustable between 10, 5, 2, and 1 dB per division.
A small red cursor follows the maximum value on the display which is
displayed on the front panel as "Signal Level". They are scaled by the
nominal gain of a transverter and displayed as"Signal Level" in dBm.
The bar graph above the Signal Level is 6 dB per bar and when all bars
are lit the FFT in the DSP is going into overload. It represents the
level coming from the FFT which for sine waves can be much greater than
the input signal.
As the bandwidth of the spectral bins is varied, the noise bandwidth
changes and, if the signal levels are adjusted to remain constant, the
noise will drop as the bandwidth decreases. This is the way to
operate the display if the primary interest is the signal. But if
the interest is the noise, the gain should go up as the bandwidth
decreases. To allow either arrangement, and any in-between, there
is a .CFG variable called "knoise." If knoise is set to 0.0 the
noise power will be kept constant. If knoise is set to 1.0 the
signal power will be constant. Because of the noise statistics it is
not always best to keep the noise power exactly constant, and for this,
knoise can even take slightly negative values.
The spectrum display can be modified by Dot Selection, Scrl F5. Most
people seem to prefer the connected lines.
The two bar graphs at the bottom of the screen (when diagnostics are so
set by Scrl F3) represent the A/D input level and the D/A output level.
These are bit-by-bit bar graphs, i.e. 6 dB/bar, and 15 bars wide
showing absolute magnitude.
Waterfall Display
As of Version 396, Alt Y selection does not select the "slide rule"
display. The Waterfall display is the default, and only display, for
the bottom right box. If the "slide rule" display is needed, UHFA.EXE
will need to be a version earlier than 396. Later DSP
programs are compatible with earlier PC programs, maintaining
functionality. Some features will not be available when using versions
prior to V 396, such as .0014 Hz tuning.
The top-right box of the DSP-10 screen is a graphical plot of the audio
spectrum, expressed as power in dB versus frequency . The lower-right
box is a long-term summary of the audio spectrum, called a waterfall
display. Every time the top display is updated, the lower display adds
a single line at the bottom. The color of each pixel in the line
depends on the amplitude of the upper display. The frequency scale is
the same for the two displays. Once the waterfall gets to the bottom of
the box, it automatically scrolls up 10 lines and old data at the top
of the waterfall is discarded.
Several controls affect only the waterfall. Contrast and
brightness determine the DB levels at which the upper display is
"sliced" into colors for the waterfall. For instance, high
contrast levels compress the colors into a tight cluster. When changing
the controls a color bar will appear in the upper box, and can be set
by experimentation. Some settings may cause the colors to move
off the top or bottom of the upper box. Even though the signal
and colors are above the display, they will still continue to be sliced
and displayed on the waterfall. The particular colors used in the
slicing can also be adjusted.
The speed at which the waterfall progresses is set by the data
averaging being used (Alt-F3 and Alt-F4)
The frequency scale for the waterfall tracks that of the upper box and
is generally set by Alt-J to 1200, 2400 or 4800 Hz. There are
some exceptions, such as FM, LTI and EME-2 modes, where the display
width is modified.
On the left side of the waterfall is the current time. This can either
be hours and minutes, or minutes and seconds, as set by the
configuration variable, show_secs.
Filtering
Audio Filters - There are now 8 audio filters, set by F4 and
toggled on
and off by F3. The default filters are:
#1 MTCH12 W8MQY matched 12WPM filter_mask= 1
#2 6CW200 200 Hz at 600 Hz filter_mask= 2
#3 6CW300 300 Hz at 600 Hz filter_mask= 4
#4 6CW450 450 Hz at 600 Hz filter_mask= 8
#5 7CW600 600 Hz at 700 Hz filter_mask= 16
#6 SSB-N 250 to 2500
Hz filter_mask= 32
#7 SSB-M 200 to 2900
Hz filter_mask= 64
#8 8CW300 300 Hz at 800 Hz filter_mask=128
(#8 is also Design-a-Filter)
There is a filter_mask
variable in the UHFA.CFG configuration file .
Filters 1 to 8 have values 1, 2, 4, 8, 16, 32, 64, and 128. These are
added together to determine the filters that will be available.
For example, if you wanted to have filters 1, 3, 5, and 7 available,
the mask would be 1+4+16+64=85.
The W8MQY matched filter is fun and useful. It is a sin(f)/f shape
which is the ideal shape to maximize the S/N on a CW station. Filter #1
is set for dots at 12WPM. You must use the spectral display to tune the
station exactly to 600 Hz. You can't tune by ear because it has
responses on the side and the response falls off slowly. But it must be
peaked, because the nose of the response is sharp and the sides must
hit the side responses quite closely. When a weak signal is tuned in,
it hops right out of the noise! If it is way off in code speed it won't
work right either.
All of the filters use a 200 term FIR filter running at a 9600Hz sample
rate, giving excellent performance.
Design-a-Filter - As described above, there are
8 audio filters, 1 to 8. The first 7 are fixed but #8 can be
customized. The filters are all bandpass and require a lower and upper
cutoff frequency. Filters that are narrower than achievable will not
show the "asked for" bandwidth, but will represent the best that can be
done.
The plot in the Design-a-Filter dialog box shows the effect of both the
filter design and the receive audio equalizer.
Use the keyboard
command Scrl-F4 to bring up the Filter
Design box. Pick your parameters and see the results on the graph at
the top of the box. After closing the dialog box, the new filter
coefficients are always down-loaded to the DSP filter 8. If you
are in filter 8 you get to hear it being changed! If a check mark is in
the box "Use Filter on Exit" the filter selection will change to 8. If
you do not hear the filter, you do not have the audio filter "on" (F3).
The effects of the "1st Sidelobe, dB" line in the Filter Design box are
not obvious. Outside of the pass-band, the filter response tends to be
a series of hills, or side-lobes, that diminish.. The first side-lobe
can be raised or lowered in the "1st Sidelobe, dB" line. The
advantage of not pushing this side-lobe unnecessarily low is a more
rapid transition from the pass-band to the stop-band. Generally
the parameter should be between 40 and 70 dB, but values between 0 and
99 dB are allowed.
The narrowest filter achievable depends on the sidelobe level. Roughly,
a narrow bandwidth of 50 Hz wdith comes from 70 dB sidelobes, and a
narrower bandwidth of about 25 Hz comes with 30 dB sidelobes. These
"very narrow" filters are interesting to experiment with, but their
utility is questionable!
Receiver Audio Equalizer - The equalizer is only availble with
the
FIL-8 selection. FIL-8 uses the 14 point graphic equalizer listed
under aeqrdb in the UHFA.CFG configuration file. The
frequencies are printed in a comment line below the values. Each value
is for the range between adjacent frequencies, so the first value, -100
is for 0 to 200, the second value is for 200 to 400 and so on. All
values are relative dB and can be anything up to +/-100 dB. Thus
you can use the equalizer to add a notch band, or whatever.
Again, the plot in the Design-a-Filter dialog box shows the effect of
both the receive audio equalizer, and the Design-a-Filter.
As with other portions of the UHFA.EXE program, the filter design will
operate without a math co-processor. However, you will find the
slowness to be very annoying!
I-F Filtering - The architecture of the DSP-10
applies DSP I-F filtering before either the FFT spectral processing or
the Hilbert-transform SSB summation. This filter was originally
chosen to be very conservative in removing alias signals. The
results of this could be seen on the spectral display where the
frequency response rolled off rapidly above 2.8 KHz. There is the
option of a wider I-F filter that holds the response up to above 4 KHz.
This is toggled in and out by Alt-$ (or Alt-Shift-4, if you
like). The drawback is that a strong signal in the spectral display
frequency range of 4.8 to 5.4 will be seen as tuning the wrong
direction from 4.8 to 4.2 kHz. This is normally not a problem and
the wide filter should generally be used. The I-F filter width is
displayed as a 'N' or a 'W' following "Filter" in the left-hand column.
As an aside, for the technically curious, the I-F filtering is applied
as a pair of low-pass filters on the I and Q outputs, following the
DSP-implemented third conversion. This is totally equivalent to a
band-pass filter applied before the third conversion. Audio filtering
is applied after the Hilbert-transform SSB summation. Within the
limitations of the Hilbert-transform accuracy, this is again equivalent
to I-F filtering.
Filter Gain- As you change filters there is quite a
bit going on, some of which is the gain of the filter. Narrow-band
filters can have a lot of gain to sine waves at the center freq. The
matched filter has a gain of 64 but the wide SSB-N filter has a gain of
1. If the filter gain is all removed, the noise can become so weak that
it is lost in the least-significant bits of the DSP. When this happens,
the noise sounds distorted and weak signals have harmonic distortion,
all of which is unpleasant to listen to. If you have outside gain
(preamp, converter) raising the receiver noise level, removing the
filter gain is not a problem and the noise/weak signals sound fine.
But, if you don't remove the gain, strong signals change level as you
change filters, which can be annoying, and tend to cause overload
problems.
So, to make this work, there is a configuration file variable called
kfilt that can take values from 0.0 to 1.0. If it is 1.0 the gain
to sine waves is constant. If it is 0.0 the gain varies according to
the FIR filter. Starters: if you have no distortion on noise and weak
signals use kfilt=1.0. If there is distortion start reducing to
kfilt=0.5. It is unlikely that you would need 0.0, but... This is
only available in the .CFG file.
There are 7 "fildat" entries that you will see in the .CFG file. These
are a series of 9 parameters that specify filters 1 to 7. Changing
these parameters will not change the filter! These are informational
inputs to the PC program so that one can change the FIR filters in the
DSP and then get the display to agree with the the FIR. As of now,
there are only 2 parameters used, the |name| that appears just after
the filter number and gain which is the last parameter. The gain is a
power of two that is the inherent voltage gain of the FIR filter.
Eventually, the filter response will be shown on the spectral display
as a tuning aid. This provides the information to make such things work.
Table of Contents
LMS De-Noise and Auto-Notch Filtering - These adaptive filters
provide
either automatic peaking at the frequency of coherent signals, such as
a tone, or even voice, or, alternatively a notch at any coherent signal
frequency. Multiple peaks and notches are possible. If only noise is
present, the automatic peaking will not find any coherent signal and
will appear to suppress the noise, relative to a tone or voice signal.
Thus the common nomenclature, "de-noise." Excellent background for
these routines is an article in September 1996 QEX by Johan Forrer,
KC7WW. This was the basis for the routines used here.
Both of these adaptive filter needs different settings, based on the
signal levels. They should be used with the AGC on to both minimize
this problem and to get the gain up high enough for best operation. It
may be desirable to follow the LMS De-Noise by a bandpass filter (F3,
F4) to reduce the high frequency singing. Try SSB-N or SSB-M along with
the De-Noise.
LMS De-Noise and Auto-Notch is activated with Shift F3. You set
the adaptation gain with CTRL-F3/F4. The latter is scaled 0 to 100 and
if you get lost, 40 is a good starting point. Too low and it can't find
a signal, too high and it oscillates.
A second adjustment is the decay rate, set by the variable
denoise_decay in the UHFA.CFG configuration file . This variable
controls how long the denoise waits for a signal to return after it has
been found. Too high and it can built in strange ways on noise. Too low
and it loses good answers after they are found, resulting in poor sound
and low output. Around 90 is a good start.
The LMS De-Noise delay-line length is adjustable from the variable
denoise_del_len in the configuration file . The default length is
61, (denoise_del_len=1 ) while the other option is 31 (
denoise_del_len=0 ) that may under some circumstances be superior for
voice signals.
The LMS auto-null is activated by sequencing through the LMS options,
OFF, DENOISE and AUTONOTCH with SHIFT-F3. The adaptation gain is
adjustable by using the same adjustments as for the Denoiser (CTRL F3
and CTRL F4). Higher numbers are more aggressive autonotching. At 0 it
does nothing and by 30 to 50 it should get most any collection of
steady, clear tones. It can't find coherence in rough or noisy tones
and doesn't do well on those (this is why a voice can almost completely
make it's way through). Be careful about accidentally leaving the notch
on while on CW!.
By the way, LMS stands for Least Mean Squares and is the name of
the algorithm used, a part of 'Adaptive Filters.'
LMS denoise/notch and the audio filter can run simultaneously.
Play with combinations if you want.
Table of Contents
AGC and RF Gain- The AGC is audio derived and has fast-attack
and
slow-release. The release time is adjusted by Scrl G and Scrl H. A
setting of 0 turns the AGC off and drops the no-signal gain by 48 dB.
This needs to be made up for by an increase in the AF Gain. The 48 dB
of AGC range is about all that is useful for the dynamic range of the
AD1847 A/D. This all takes place within the DSP.
External to the DSP is the RF Gain control that allows about 36 dB of
additional dynamic range. At full 100 RF Gain, overload of the receiver
takes place at an input level of about -55 dBm which is about 400
microvolts. Although this is a very strong signal, if there are local
stations nearby, problems may occur. The manual RF gain reduces the RF
gain by about 36 dB, raising the maximum input to about -19 dBm or
about 25,000 microvolts. Unfortunately, this also reduces the receiver
sensitivity, so it is normally best to run with full RF gain.
The overload characteristics depend on the frequency of the strong
station. The A/D converter only "sees" a strong station if it is within
about 10 Khz of the indicated frequency. Outside that range, the
dynamic range is limited by, cross-modulation, intermodulation, and
blocking. These effects require quite a bit more interferring signal
level than overloading the A/D converter.
Starting with ver 396 of UHFA.EXE, there is the ability to change the
RF gain using PAGE UP, a single, unmodified key. This is useful when
multiple stations are engaged in net style operations or situations
where one station overloads the ADC, and the operator would like to
copy the station causing the overload. This works by changing the gain
by a in multiples of the 6 db gain steps. Available steps are 6, 12,
18, 24, 30 and 36, corresponding to 1 - 6. The step can be modified in
the configuration file, UHFA.CFG in the entry rfgain_toggle.
Binaural Audio- This is a simple function that does a
lot. Read
Rick Campbell, KK7B's article in March 1999 QST. He creates the
binaural sound by getting independent noise and correlated signals from
I and Q channels. The DSP-10 binaural audio works by delaying the sound
for the right ear. With sufficient delay the noise going to the two
ears becomes independent. The signal, depending on it's frequency stays
fixed in position and your mind does the rest, just like in everyday
life. Try it. It is great for CW and on voice it sounds like you are in
the room with the other station. Preliminary results indicate that it
improves sensitivity on weak signals. It certainly reduces fatigue.
More information is also available in the ARRL book Experimental
Methods in RF Design (Chapters 9 &11).
You may find that the effect is not as pronounced if the audio
bandwidth is too narrow. Experiment to see what works for you.
The binaural audio is toggled on and off by ALT-E keyboard commands.
The amount of delay is adjustable is powers of two, by the
configuration file variable
delay_right . The default is 1024 set by a
value of 9 in CFG. Values of 1 to 10 are allowable with 1 being 4 delay
units, 2 being 8 delay uits, up to 10 which is 2048 delay units.. Each
delay unit is 1/48000 sec, or 20.8 microseconds, so the default delay
is 1024x20.8 microseconds=21.3 milliseconds.
Moon Information -
Automatic EME Doppler corrections for the receiver are available with
ALL modes except FM, even SSB. This correction is done with high
accuracy to support the weak-signal modes of chapter 2. A by-product of
the high Doppler accuracy is excellent data for azimuth and elevation.
The data is displayed as a SCRL-F3 option. Azimuth, elevation, Doppler
shift, and relative signal level are displayed.
To make the Moon Doppler calculation possible, it is necessary to know
the latitude and longitude of your station and the other-end station
(that can be your station again, for self echoes.)Your station is
referred to as 'loc 0' and is always part of the EME path for Doppler
as well as the location for az and el calculations. There can be up to
9 more locations that are used for the second half of the Doppler
calculation. All locations may be entered from a Dialog Box opened by CTRL U.
All 10 'loc i' may be still entered through the UHFA.CFG file. The
format is shown as a comment in the file. Each line looks like
loc 0 |W7XYZ| |W7XYZ's location| 44.123 -123.567
where the vertical bars delimit strings. Put 2 spaces outside the
vertical bars. The first string is 6 characters, or less, and uses in
the Moon display line. The second string is up to 31 characters and
allows more detail about the location. The latitude and longitude are
in decimal degrees. If your GPS gives you degrees and minutes, use your
calculator to divide the minutes by 60 and add onto the degrees. West
longitude must have a leading minus sign.
There can be anywhere from 0 to 10 locations. They can be in any
positions and if they have not been entered in the UHFA.CFG file they
are skipped over by the '<' and ' > ' commands.
All loc's can be seen in detail in a table on the last Help screen (F1.)
EME Doppler Corrections - Receive frequency correction for EME
(MoonBounce) Doppler is available for CW and SSB (as well as the
weak-signal modes LHL-7 PUA43, EME-2 and LTI that are detailed
elesewhere). The correction can be toggled on and off by ALT L, or ALT
l. It is in effect only when an EME path is being displayed on the
bottom line. An 'E' below the frequency readout means the feature
is enabled. If a receiver frequency is displayed to the left of the
'E", then the correction is being used. There are situations when
the 'E' will show in beige, but the frequency is not displayed and
corrections are not being made. An example of this is the FM
mode. When the Doppler correction is being made, CW and SSB
stations will be received as though no Doppler shift existed. For
example, if the other station is transmitting USB on 144.085 000 MHz
and the Doppler shift is 234 Hz, the Transmit Frequency box can
be set to 144.085000 and the station will be tuned in. The
receive frequency will show as "144.085 234 E."
Note that the PC clock needs to be set closely to have the correct
EME-Doppler correction. At 2-meters an error of 1 minute can
create a 1 Hz error. At 1296 MHz, this will be 9 times greater.
Software clock corrections can be applied to correct the clock as is
explained below for the "PUA43 Mode." But, in general, it is best
if the PC clock is maintained within a few seconds of UT/Local Time.
Sun Noise - To aid in Sun noise measurements, the az-el
coordinates of
the Sun are displayed (Scrl F3.) The dB number is the slight variation
in Sun distance that occurs over the year (Sun distance^2.) For the
Sun, the location of the az-el coordinates can be changed to all 10
loc's. Also with this VERSION we have the P2T which eases the peaking
and measurement of Sun noise.
Power Measurements - There are three different power measurements
displayed.
When in any of the active diagnostic modes (Scrl F3,) there is a dB
number in the very lower-right corner. This is the average power of the
spectral display, converted to dB. This is appropriate for Sun/Earth
noise measurements, as long as no signals are present.
The ' Signal Level '
displayed on the left, under the S-Meter bar
graph, is the spectral level at the highest point (the little red
marker.) This marker is the highest amplitude level at frequencies
above 200 Hz. This avoids being captured by 60 or 180 Hz pickup noise.
Finally, the rms value of the input signal is calculated in the DSP and
is displayed below the S-Meter when the mode is FM. This is a
specialized measurement that can be used for signal plus noise
measurements.
In the DSP the average power is computed over the entire 12 kHz
bandwidth used for FM. This is done 48,000 times a second. After
converting to dB this is sent to the PC for display. The relative
accuracy of this power computation and logging is better than the
0.01 dB that is displayed, making it very suitable for Sun noise
measurements. This is also more accurate than the spectral average
power levels that are shown in the lower-right corner in diagnostic
modes 1 and 2.
Data Record - The logged power data after non-coherent
integration can
be saved directly to disk. This is toggled on and off by the Alt F
command. It is saved to a file called UHFA1.DAT and if the file exists,
it is appended to the end of the existing data. The data is time and
date stamped for future use. It is not compacted, though and can
produce some big files. To reduce the file size increase the
non-coherent integration (Alt F4). The beginnings of a companion
program EDFILE01.C and EDFILE01.EXE is available. It reads the data
file and replays the data allowing additional smoothing as well as
Doppler slope correction and various other feaures. EDFILE is not
documented except through the C listing, but the program listing
comments do much to describe the operation.
LTI , PUA43 , and EME-2 weak-signal modes also have data saving
from the ALT-B menu respectively.
Screen Saves - Sixteen color snapshots of the entire screen
including
the spectral displays can be taken and stored as .GIF files. These can
be printed or edited with graphics printing programs, or handled with
your Web Browser. The GIF file is given a file name Uoddhhmm.GIF where
o is the month as a single hex character (1,C), dd is the day (1,31),
and hhmm is the time. The default leading character 'U' can be altered
from the UHFA.CFG configuration file by the single character for the
variable file_ident. Note that the same variable sets the leading file
name character for all data output files. For example, to set the
leading character to 'H', the configuration file should contain the line
file_ident |H|
There are two spaces preceeding the vertical bar.
Automatic Screen Saves - Screen saves can be done automatically
on a
periodic basis. The configuration variable, scsave defaults
to 0, but
if it is set to a value greater than zero, it becomes the number of
minutes between saves. One should use this with care or be prepared to
see many screen save files! To produce an automatic screen save every
10 minutes, place the following line in the configuration file:
scsave 10
The maximum value for the interval is 1439 and the count resets at
midnight. These automatic screen saves are at the top of the minute.
The directory for screen saves defaults to the same directory
thatcontains UHFA.EXE. This can be changed by the configuration file
variable fscreen_path. Leaving this variable blank continues to use the
default directory. If one wanted to use the A drive, the following line
should be in the configuration file:
fscreen_path |A:\|
As with all string variables, there are two spaces ahead of the first
vertical bar.
ON-SCREEN COMMENTS - When (ALT-G) Screen save is entered, a modal
dialog box appears in the lower right corner of the waterfall area.
This allows two lines of comments of 24 characters each. Enter text and
use the scroll up and down arrows or backspace as needed. When the box
is ended with an ENTER, the box is redrawn at minimal size and the
screen save continues, including the comments. Then they are cleared
and the missing screen replaced. If no comment is needed, just hit
ENTER (with no comment entered) and the box disappears and the screen
is saved. Default is to have the comment box open with screen
save ALT-G and can be changed to disable this action by changing
"use_scs_box 1"
to "use_scs_box 0"
Auto-Display - Shown as AutDisp on the left side of the front
panel
screen, this is toggled on and off by the ALT-C keyboard
command . The
purpose of this function is to keep the spectral display at the same
average height, even though the receive gain may have changed with
temperature or other factors. This is important when dealing with weak
signals and the display is in 1 or 2 dB/div. For ordinary operation the
AutoDisp should be Off. Otherwise, the noise level appears to go down
every time a strong signal is tuned in note that AutoDisp stops the
display of the average spectral level that can be seen in the
lower-right corner with diagnostics mode 1 or 2. This is the value that
is kept constant!
Shut Down - If you use the Scrl-Alt-F4 command to quit to DOS
you will
not only feel like it was more orderly than using the power switch, but
you also update the configuration file. This will cause the transceiver
to start with the last used parameters when you start up next time.
This assumes that you have not added a line of "quit_save_state=0" to
the configuration file.
Bottom Data Line - The Scrl F3 changes the bottom. There are
seven
different data lines that are sequenced through:
0 No data, but index lines that line up
with upper screen frequency ticks.
1 DSP status byte dump
2 A/D and D/A level bar graphs
3 Moon data
4 Sun data.
5 time data
6 latitude, longitude, height and grid square,
derived from the GPS data.
The DSP status line is not easy to read. It consists of the 19 status
bytes, printed in hex, (0 to 9, A to F), followed by a letter idicating
transmit or receive, the current UHFA.EXE version and on the right a dB
value that is the relative power in the last white trace. For many
purposes, there are only a few items of interest. The first byte is the
versin number for the DSP software, UHF3.EXE. As of February 2003, the
only values that support the PC software are 20 and 21, corresponding
to DSP software versions 2.0 and 2.1. Just past the 'R' (or 'T') is the
PC software version. This should be a number, such as 3.00.
The A/D and D/A levels represent the highest value seen by these data
converters that are on the EZKit Lite.There are 15 bars that start whte
on the left, progress through green and end with 6 red bars on the
right (these are the default colors---others may be set in the
configuration
file ). These bars represent the magnitude of the 16 bit
data converters, requiring only 15 bars since the sign bit is not
involved. Each bar represents a 6 dB increase in level above its
neighbor to the left.When all bars are in use, the data converter is
either about to overload, or is doing so. It is normal for several
white bars of the A/D level to be in use, even if no input exists. This
represents the A/D noise that restricts the dynamic range of the
converter.
Cursor Keys for Tuning and Audio level - Here is a neat one, the
W7SZ
cursor keys. This thing is so convenient, I am really not sure
that one needs a knob!! These are the cursor keys at the lower right of
the keyboard:
Left Arrow Frequency down a little
Shift Left Arrow Frequency down quite a bit
Right Arrow Frequency
up a little
Shift Right Arrow Frequency up quite a bit
Down Arrow AF
Gain down a little
Shift Down Arrow AF Gain down quite a bit
Up
Arrow AF
Gain up a little
Shift Up Arrow AF Gain up quite a bit
Page Down AF Mute toggles on and off
As can be seen, the shift key changes the amount. I like 50 Hz and 1
kHz for frequency and 2 dB and 10 dB for AF Gain. These are defaults,
but are set in the UHFA.CFG file by delf, delf_sh, deldb, deldb_sh .
The values can be negative in which case the <- become freq up. For
instance, if you wanted to change the cursor tuning (without shift) to
25 Hz, alter the configuration
file line for delf to delf 25
Tuning with milli Hertz Resolution
With version 396 additional tuning steps of .0014 Hz are available .
Version 3.96 expands on this, adding additional keyboard entry for
steps of 1, 10 and 100 milliHz. These tuning steps are available when
the frequency display box is displaying nine places past the
decimal.
The
direct frequency entry box, ALT 9 can also be used to enter the
frequency directly while the display is in milliHz tuning mode. Use
Scroll Lock plus Z (<SCRL><Z>) to toggle tuning resolution.
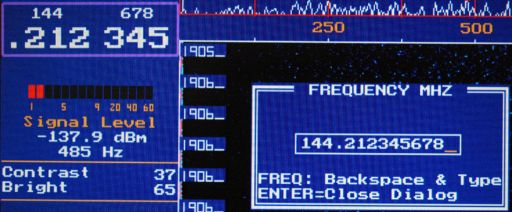 milliHz tuning steps enabled
The
UHFA.CFG file can be edited to use the delf, delf_sh, (left and right
cursor) to assign these frequency steps to the cursor keys, as below.
//*** Keyboard definitions (memch_kbd) ***
//
delf .010
delf_sh 2.000
Note that all of the above require the
milliHz tuning to be enabled. If the cursor keys are assigned to
less than 1 hz steps,they are not active when milliHz tuning is off.
This is a possibilty, not a recommendation.
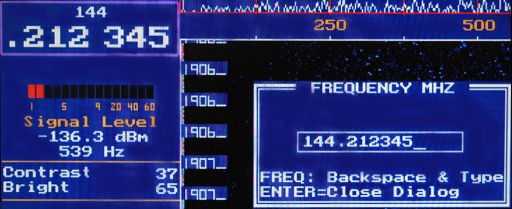 milliHz tuning steps disabled
S-Meter - The S-meter bars are tied directly to the dBm number
under
them. S1 to S9 are exactly 6 dB each and the bars over S9 are 10 dB
each. In addition the S-meter numbers and bar graph now work for
signals that are off-screen on the upper spectral display. To
make this happen, there is a change in the mode of operation at about
-100 dBm input. Below that level the signal strength comes from the
spectral data, indicating the peak on the upper spectral display that
is marked with a red circle. At higher levels, an RMS (power)
calculation in the signal band (from the DSP) is used. The
transition is indicated by a 'P' showing to the right of the strength
number, meaning that a power measurement is being used. Including
the RF gain, this gives an input range from about -150 to -25 dBm that
is displayed correctly. If one is using the Signal Level display
to make comparative measurements, it is desirable to avoid switching
between the two methods of measurement.
Time Marks - The time marks on the waterfall can show either
mm:ss(default) or hhmm. The hour and day can often come from the lower
left corner. The use of mm:ss allows you to identify a time in the
waterfall to the second. If you want to use hhmm, change the
variable show_secs in the .CFG file to 0.
Mode Mask - This is a UHFA.CFG
configuration file variable that allows the operator to ignore
transmission modes that are not of interest. It is the sum of the
values for each mode desired. The values are listed below, and also in
a comment in the .CFG file, just above "mode_mask x." As an
example, if one wanted to only have CW=1 and USB=2 available, they
would set mode_mask=3. In order to not allow a modeless radio,
the CW mode is always available.
CW mode_mask= 1
USB mode_mask= 2
LSB mode_mask= 4
FM mode_mask= 8
LHL7 mode_mask= 16 removed in Version 394
PUA43 mode_mask= 32
EME2 mode_mask= 64
LTI mode_mask=128
Last Key Hit - If you ever wondered what key you hit, it now
shows in
the lower left, if the keystroke had any effect. It shows the function
of the key, abbreviated to 6 characters. This also lets you find out
how things work by hitting keys experimentally!
Out-of-Lock - This hardware feature indicates if either of the
phase-locked loops is not locked. Running your frequency up and down
and watching the error message shows the lock limits. Mine showed
143.35 to 148.8.
Vertical Cursors Flag Posts, and Goal Posts - Provision is made
for
placing fixed cursors on the screen for lining up the received signals
on the upper and lower spectral displays. These are available in
various modes, where they make sense:
| MODE |
SINGLE
CURSOR |
DOUBLE CURSOR |
| CW |
CW Offset Frequency |
None |
| LTI |
Center
Frequency |
Low and High from ALT-B
Box |
| EME2 |
Center Frequency |
Band Edges from ALT-A Data |
| LHL7 |
Times-2 Frequency |
End
of Character & Times-5 |
| PUA43 |
CW ID Frequency |
Band Edges |
The Single and Double cursors are turned on by the CTRL-A and CTRL-D
keys. They are turned off by hitting any key, except ALT-G; that will
do a Screen Save with the cursors still showing. At the bottomline of
the screen, the frequency of the Vertical cursors is shown, in Hz.
Audio Processor - All of the the regular functions are
available
without RF hardware, using the DSP-10 audio processor .
Table of Contents
Valid HTML 4.01 Transitional
V396