Introduction - The use of built-in test equipment for amateur radio equipment has been limited. Most radios have some form of power measurements for transmitting. VSWR as seen by the radio is often displayed. On the receiving side, it is possible to make some deductions from the spectral displays that have become common. This sort of performance monitoring has not kept up with the computational capability that exists today. This note proposes a system for measuring receiver sensitivity that is compatible with home-brew receivers and could even be built as an add-on for many commercial radios. This particular implementation was for my Tiny Ten transceiver, but it is quite general in potential applications. I suggest that something like this be included with all amateur radio receivers.
Measurement of receiver sensitivity is always conducted at very low power levels. Doing this measurement accurately requires a reference power and at least two power measurements, since we have two degrees of freedom that we can think of as signal power and noise power. If one has access to a known noise source, this can provide the reference power and the so called "Hot/Cold Noise Measurement" can produce very accurate measures of receiver sensitivity. A more commonly available reference power is a calibrated signal generator that can produce an RF sine wave of known power. The potential for error in the power level of the reference signal may limit the accuracy of the measurement, but often we only need an answer accurate to a dB or so, which is practical. What follows is a method, that is mathematically precise, that uses the signal generator as a power reference.
Procedure - To make this system operate, the receiver must be in a mode, such as SSB or CW, that linearly converts the input RF to either a low DSP I-F or converts it to audio. Alternatively we can work directly at a low frequency I-F. There can be some filtering of this signal, but there needs to be a frequency range that is reasonably flat in response. The hardware setup applies the output of the signal generator to the antenna terminals, with the frequency set to have the resulting signal near the middle of the I-F or Audio band. The level of available power from the generator is set in the general range of a microvolt (-107 dBm). For the procedure here, a 1024 point FFT is applied to the I-F or Audio signal with a Hann window. The output of the FFT will consist of two quadrature "voltages" that can be turned into power by adding the squares of the two outputs. Multiple FFT power outputs are averaged to make the measurement more accurate and here we will assume this to be 100 averages. This ends up with 512 power data points, with each measuring a scaled level of signal power plus noise power.
As a quick aside, note that the FFT followed by the power calculation, as described in the previous paragraph, is equivalent to 512 equally spaced band-pass filters with power meters hooked to the outputs. Regardless of whether it is a sine wave or noise, the answer is total power at that frequency. More details of this principle are in section 10.10 of Experimental Methods in RF Design. This total power principle will be used below to convert signal plus noise power into just signal power by subtracting the noise power measurement.
We want to find the total signal power and the average noise power in order to calculate the signal-to-noise power ratio. The FFT powers allow us to do this. First, find the highest power of all the FFT bins. We might restrict the spectral region of interest. For instance, if an audio signal of 1000 Hz is our center, it is often easy to set the signal generator withing 100 Hz, and we could restrict the FFT region of interest to 500 to 1500 Hz. It does not need to be narrow, as the bandwidth of the measurement is fully determined by the windowed FFT. We make note of this strongest power FFT bin and then also record the power for 5 bins lower in frequency and for 5 bins higher in frequency, a total of 11 numbers. The average of powers for the lowest two and highest two will be our noise power estimate, called nav. The remaining 7 center bin powers will estimate the signal power, sav, by taking the sum of the 7 powers that have had nav subtracted. The signal power will not be all in the highest bin since there is windowing and the frequency being received will not be exactly at the bin center. Our process corrects for these effects.
Next we find the actual signal-to-noise ratio as snr=sav/nav. The bandwidth of our noise estimate is needed to make sense of all this. We have 1024 bins spread across the sampling frequency, fs. Therefore, each bin must have a noise bandwidth of bw=fs/1024. Windowing increases the bandwidth of any single bin by a factor, which for the Hann window is 1.5. Each bin loses a third of its power to the neighbors, but each bin also picks up noise power from the neighbors. All of this is uncorrelated or power addition, so the net effect is just a fixed power per bin. Thus, the total noise power bandwidth is bwt = 6*bw. In dB relative to 1 Hz this is BWT=10*log10(bwt). We can now calculate the "Noise Figure" (see Wikipedia) as the decrease in signal-to-noise ratio (snr) in going through the radio. The input SNRin=10*log10(snr) is the -107 dBm signal power minus (-174 dBm + BWT). The noise here is that of a room temperature resistor, -174 dBm adjusted for the bandwidth BWT. The output SNRout was measured as 10*log10(snr) the noise figure in dB is NF=SNRin-SNRout.
Another common sensitivity measure is minimum discernible signal (MDS), which for the ARRL is measured as the signal power being equal to the noise in a 500 Hz bandwidth. We can calculate this by noting that the noise increases by the ratio of 500 Hz to bwt. The MDS becomes -174+NF+10*log10(500/bwt).
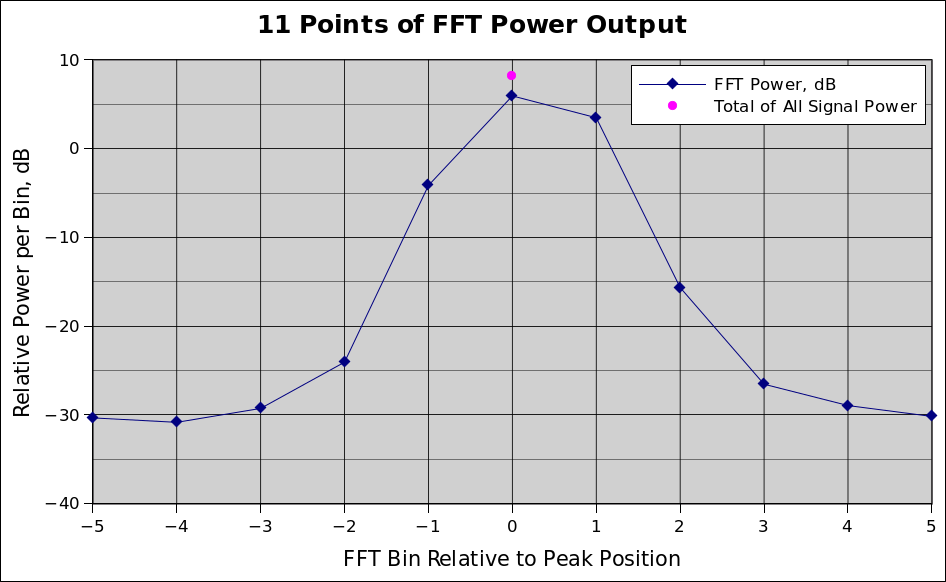
Example - Here are 11 real data points. The first two columns are the FFT output power in relative dB and in relative power. The next column is the power of the signal only, obtained by subtracting the estimated bin power level.
FFT dB   S+N Power   Sig Power   Contents
-30.33   0.0009268               Noise
-30.83   0.0008260               Noise
-29.26   0.0011858   0.0001880   S+N
-24.05   0.0039355   0.0029378   S+N
 -4.14   0.3854784   0.3844806   S+N
  5.94   3.9264494   3.9254516   S+N
  3.48   2.2284351   2.2274374   S+N
-15.65   0.0272270   0.0262293   S+N
-26.54   0.0022182   0.0012205   S+N
-28.94   0.0012764               Noise
-30.17   0.0009616               Noise

Outside 4, Ave Noise Power = 0.0009977
Total Sig Power = 6.5679
Total Sig Power, dB = 8.17
Here is an output from the program with the radio in LSB and tuned to 14215.000 kHz. The signal generator was set to 14214.000 kHz at -105 dBm:
SENSITIVITY TEST - Sig Gen should be set to -105 dBm.
Results:  NF = 14.11   MDS dBm = -132.90
   Output SNR in 1 FFT Bin of Noise, dB = 38.18
   Center Frequency, kHz = 14214.003   Error Code = 0
FFT Power Data for 11 Bins: [As Above, -30.33, ...]
Hardware - So, where are we going to get the test signal? Here, we are talking about doing the measurement in an existing radio. I have several older signal generators that provide reasonable power accuracy at the -100 to -120 dBm range. Wondering what could be more generally available, I was talking with Rick, KK7B. He had just been using his Tiny Spectrum Analyzer and told me about the Signal Generator capability of that device. I had never thought of that possibility, and so, got one out and was pleasantly surprised to find that I could produce HF signals of good accuracy with excellent control of stray radiation. But, first, note that not all models are the same. Mine was acquired from the Zeenco store and I believe is an Ultra ZS405. For sure, it can generate sine waves up to 800 MHz and displays a minimum power of -124 dBm. In the HF region, the calibration of the power level at -100 dBm seems to be within 1 dB. I would appreciate any other checks on these signal sources, if you have measurement capability.
A note is that, if you have a 50 Ohm source and can measure the level at high levels, say 0 dBm, it is practical to gather some 50-Ohm RF attenuators and use them to drop the level to, say, -110 dBm. The high level might be calibrated by a power meter. Or, lacking that, an oscilloscope might be adequate. The attenuators can be checked for good health by measuring the DC resistance when the opposite end is terminated in 50 Ohms. The healthy ones can be calibrated for low frequency attenuation, that is for HF frequencies, by measuring the loss at DC, converted to dB. Finally, screw all the attenuators needed into a string and add the individual dB values.
If you are doing a new design, it would be easy to build in a signal source along with a method to switch it in as an alternative antenna. The source is simplest if it includes a mixer, so that the generated signal is never strong enough to have leakage problems. The LO could be a spare Si5351 (or similar) output. The signal generation would be in DSP where we can have 100 dB of attenuation with very good accuracy. The LO may have some spurious outputs, but these can always be dealt with since we get to choose the exact measurement frequency.
In the end it is a matter of using what is available and getting the most accurate power value that you can. If we are off a dB or two, we are still a lot more knowledgeable than we were!
Some C code - I normally like to not clutter these write-ups with computer programs. This case seems to need it, though, as it illustrates the level of complexity needed for this test method. So, I tucked it here at the bottom!
This is the C-program snippets that are in the Tiny Ten transceiver. It consists of a global structure that gives easy access to the test results. Then, there is a place to run the test, which I chose to be a one-time call by putting it in the setup() function. Finally, there is a testSensitivity1(...) function that runs the test and puts the results into the structure. This is all plain C-code. I left my debug print statements, commented out, in the function. Normally all printout is at the function call. I won't try to say anything more as the code has comments.
CODE - The following structure definition is global
#ifdef TEST_SENS
// Structure to return data for sensitivity self-test.  See testSensitivity1(...)
struct resultSens{
   float32_t mdsDBM;        // Min discernible signal = noise in 500 Hz BW
   float32_t noiseFigureDB;
   float32_t snrOut1BinN;   // In dB
   float32_t freqCenter;
   uint16_t  firstBin;      // Lowest bin (6, 505) of search
   uint16_t  lastBin;       // Highest bin (7, 506) of search
   uint16_t  highestBin;
   uint16_t  secondBin;
   float32_t powerDat[11];
   uint16_t  errorCode;
   };
#endif
The following is executed once in setup(). It should either be cut and pasted as needed or it can be activated by a "#if defined TEST_SENS" type of pre-processor directive.
   // Evaluate receiver sensitivity
   struct resultSens sensDat;
   // if FFT1024_1.available() returns true, it also starts a new FFT power sum
   uint32_t ttt=millis();
   while( !FFT1024_1.available() ) ;
   Serial.println(millis()-ttt);
   while( !FFT1024_1.available() )   {delay(1); }
   Serial.println(millis()-ttt);
   // The power level is typed in here in the call.  It could be fancier.
   // 170 to 470 covers 8 to 22 kHz at a 48 kHz rate
   testSensitivity1(&sensDat, sample_rate_Hz, FFT1024_1.getData(), -105.0f, 170, 470);
   Serial.println("");
   Serial.print("SENSITIVITY TEST - Results:  NF = ");  Serial.print(sensDat.noiseFigureDB);
   Serial.print("   MDS dBm = ");  Serial.println(sensDat.mdsDBM);
   Serial.print("   Output SNR in 1 FFT Bin of Noise, dB = ");
   Serial.println(sensDat.snrOut1BinN);
   Serial.print("   Center Frequency, kHz = ");
   Serial.print(0.00001*(float32_t)freqLO - 0.001*sensDat.freqCenter, 3);
   Serial.print("   Error Code = ");  Serial.println(sensDat.errorCode);
   Serial.println("FFT Power Data for 11 Bins:");
   for(int kk=0; kk<11; kk++)
      Serial.println(10.0f*log10f(sensDat.powerDat[kk]));
And, the following subroutine does the test, leaving the results in the structure. This can be put where you want, in the program.
/* Test Sensitivity.  For testing, only.  Introduce an in-band signal of known level, and
 * measure signal-to-noise ratio with an FFT to determine Noise Figure and Minimum
 * Discernable Signal.  The 1024 point floating-point FFT needs to be run before this
 * sub-routine is used.
 * Error Codes are contained in binary bits as:
 *    pDatStruct->errorCode & 1   Second Highest is not adjacent to Highest
 *    pDatStruct->errorCode & 2   Test signal power too low ( <-120 dBm)
 *    pDatStruct->errorCode & 4   Test signal too High ( > -90 dBm )
 *    pDatStruct->errorCode & 8   Output SNR too low, use higher signal
 *    pDatStruct->errorCode & 16  Low noise/High Noise not flat (possibly a birdie)
 * Various test printing has been left in, but commented out, for convenience.
 */
bool testSensitivity1(struct resultSens* pDatStruct,   // Results of test
                      float32_t sampleRate,            // In Hz Such as 48000.0
                      float32_t* pF,                   // Pointer to FFT power data (512 items)
                      float32_t powerSignalDBM,        // Power of test signal in dBm
                      uint16_t firstBin,               // Lowest bin (6, 505) of search    (these two
                      uint16_t lastBin)                // Highest bin (7, 506) of search   are optional)
   {
   pDatStruct->errorCode = 0;    // No errors
   if(powerSignalDBM < -120)
      pDatStruct->errorCode |= 2;
   if(powerSignalDBM > -90)
      pDatStruct->errorCode |= 4;

   float32_t deltaF = sampleRate/1024.0f;  // Spacing between FFT bins
   // Find the strongest FFT power
   float32_t biggest =   0.0000000001f;
   float32_t bigSecond = 0.00000000001f;
   int iBig = 0;
   int iBigSecond = 0;
   for(int i=firstBin; i biggest)
         {
         biggest = *(pF+i);
         iBig = i;
         }
      else if(*(pF+i) > bigSecond)
         {
         bigSecond =*(pF+i);
         iBigSecond = i;
         }
      }
   //  for(int i=0; i<512; i++)
   //     Serial.println(10.0f*log10(*(pF+i)) );  // Print full FFT output
   for(int i=0; i<11; i++)
      pDatStruct->powerDat[i] = *(pF+iBig-5+i);  // Return power data for the bins involved
   int idiff = iBigSecond - iBig;
   if(idiff != 1  &&  idiff != -1)
      pDatStruct->errorCode |= 1;     // Second highest is not adjacent to highest

   float32_t powerN = 0.25*(*(pF+iBig-5) + *(pF+iBig-4) + *(pF+iBig+4) + *(pF+iBig+5));   // Noise power per bin
   float32_t powerS = *(pF+iBig-3) + *(pF+iBig-2) + *(pF+iBig-1) + *(pF+iBig) +
                       *(pF+iBig+1) + *(pF+iBig+2) + *(pF+iBig+3) - 7.0f*powerN;   // Total signal power
   float32_t powerNDB = 10.0f*log10f(powerN);
   float32_t powerSDB = 10.0f*log10f(powerS);
   // Serial.print("noise db "); Serial.println(powerNDB);
   // Serial.print("sig   db "); Serial.println(powerSDB);

   // Lower noise and upper noise should be similar unless birdies are present
   float32_t noiseFlatnessDB = 10.0f*log10f(  (*(pF+iBig-5) + *(pF+iBig-4)) / (*(pF+iBig+4) + *(pF+iBig+5)) );
   // Serial.print("noiseFlatness  db "); Serial.println(noiseFlatnessDB);
   if(noiseFlatnessDB<-1.7f || noiseFlatnessDB>1.7f)
       pDatStruct->errorCode |= 16;

   // We will treat these measures as having a common, but arbitrary reference.
   // To give them an absolute reference, we move to the input plane where we
   // know the signal level is powerSignalDBM.  gainDB has little physical significance.
   float32_t gainDB = powerSDB - powerSignalDBM;  // Correction factor for signal or noise
   // Serial.print("gain   db "); Serial.println(gainDB);
   float32_t powerInMeasureSignalDBM = powerSDB - gainDB;   // Get absolute power for measured signal
   // And the measured noise power, per FFT bin, in DBm is
   float32_t powerInMeasureNoiseDBM = powerNDB - gainDB;
   // We can find the measured power S/N in a single bin of noise
   float32_t snrOut = powerS/powerN;
   float32_t snrOutDB = 10.0f*log10f(snrOut);
   pDatStruct->snrOut1BinN = snrOutDB;
   // Serial.print("SNROut in bin-width noise,  db "); Serial.println(snrOutDB);
   if(snrOutDB < 6.0f)
      pDatStruct->errorCode |= 8;
   // The input noise is room temp thermal noise in a single bin width
   float32_t noiseBandwidthDB = 10.0f*log10f(deltaF);
   // Serial.print("Noise BW, in dBHz = "); Serial.println(noiseBandwidthDB);
   float32_t powerInNoiseDBM = -174.0f + noiseBandwidthDB;
   float32_t snrInDB = powerSignalDBM - powerInNoiseDBM;
   // Serial.print("SNR In  db "); Serial.println(snrInDB);
   pDatStruct->noiseFigureDB = snrInDB - snrOutDB;
   // Serial.print("Noise Figure, db "); Serial.println(pDatStruct->noiseFigureDB);
   // The MDS is simply the output noise power in a 500 Hz noise bandwidth
   pDatStruct->mdsDBM = powerInMeasureNoiseDBM + 26.9897f - noiseBandwidthDB;
   // Serial.print("MDS in dBm "); Serial.println(pDatStruct->mdsDBM);

   // Return the estimated frequency, based on powers in FFT bins.
   // Following from DerekR
   // https://forum.pjrc.com/threads/36358-A-New-Accurate-FFT-Interpolator-for-Frequency-Estimation
   float32_t vm = sqrtf( *(pF + iBig - 1) );
   float32_t vc = sqrtf( *(pF + iBig) );
   float32_t vp = sqrtf( *(pF + iBig + 1) );
     if(vp > vm)
         {
         float32_t R = vc/vp;
         pDatStruct->freqCenter = ( (float32_t)iBig + (2-R)/(1+R) )*sampleRate/1024.0f;
         }
      else
         {
         float32_t R = vc/vm;
         pDatStruct->freqCenter = ( (float32_t)iBig - (2-R)/(1+R) )*sampleRate/1024.0f;
         }
   if(pDatStruct->errorCode > 0)
      return true;
   else
      return false;
   }
Issued 28 April, 2025. All Copyright © Robert Larkin 2025.