Brian Beezley, K6STI, proposed a horizontal loop design for
low-noise reception on the 160 and 80-meter ham bands.
This was described in September 1995 QST, pages 33-36, including arguments
why this could reject local noise. An accompaning article by Edwin Andress,
W6KUT, gives the details for constructing ne of these loops. This same
Andress information is
available on the Internet.
I contructed a loop per the Andress article, with some differences in
the dimensions. Mine was 12-ft on-a-side all made with #14 house wire.
This was on sloping ground, about 65 ft from the south edge of the house.
To make the loop horizontal, the loop was about 18-feet on the uphill
side and 22-ft on the downhill side. A single 17-ft tapered
2x6 board, supported by trees on each end,
runs across a diagonal and holds the feedlines. The other corners
are held by ropess going to trees. I attempted to photograph
the antenna, but being in a clearing in the woods made a decent
picture out of my capability.
The feed system is identical in
topology to that described by Andress, except that my loop, being smaller,
had an inductance of about 11 uH, requiring around 160 pF to
achieve series resonance. The feedpoint resistance was the smaller, as
well, so a 3 to 10 turn transformer was used.
The measured Q, loaded by the radiation resistance was about 70,
producing an 3 dB bandwidth of around 50 kHz. About 100 feet of
RG-8/U coax led off to the radio.
Next came the experiment to measure the relative performance
using WSPR reception. The loop was connected to a receiver set up for WSPR.
As a reference, a second separate WSPR receiver was connected to an 80-m dipole
that was at a height of about 50-feet above the back of the house. This dipole
favors north and south directions, with the ends at 105 and 285 degrees true.
Both receivers were operated under WSPR reception
from the start of 19 September 2013, UTC, until about 1530 UTC on
20 September. There were several interuptions in the reception,
primarily caused by a PC that chose to reset twice during the early
morning hours. A total of about 30 hours of operation provided sufficient
data.
Both WSPR setups were connected to the WSPR reporter on the Internet
with calls W7PUA for the loop and W7PUA1 for the dipole. This made
data collection simple, as the WSPR data base includes information
on the signal-to-noise ratio (S/N) being observed, as well as the location
of the transmitting station. Eleven different stations provided signals
for measurement with the result that 478 data events occurred
for which there were simultaneous measurements from both antennas
(956 total data points). For each of the eleven stations,
the difference in the dB levels of S/N for the two antennas was taken.
These were then averaged for the comparison. Note that averaging of dB
values does not average powers, but rather finds the geometric mean
of powers, converted back to dB. For large dB values, this can be
questioned, but here the dB differences are typically only 5 dB.
We are only trying to look for significant performance differences, and this
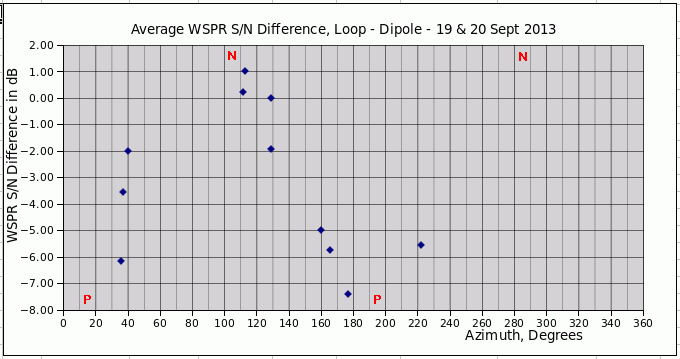
will meet that goal. The graph strongly suggests that in the directions broadside to the
dipole, the loop falls perhaps 5 dB behind. Near the end-point directions
of the dipole, the loop is able to pull even. In other words, the loop
does not provide the S/N of the dipole except in directions where
the dipole performance is poor.
This all needs to be taken
as applying to my location, and not as a general conclusion. I
generally have few problems from local man-made noise. In particular,
my noise problems are
almost all associated with computer or monitor related sources. I do not
have line noise issues. A noisier location
might have a different result. Likewise, if my dipole was lower, and therefore
closer to the house, it might pick up more noise and the loop could look
better.
In order to better understand the details of noise rejection,
I tuned a receiver carefully around the 80-m
band, comparing the man-made sounding noises using both antennas.
This was backed up by spectrum analyzer measurements. It just did not
appear that the loop was quieter. This activity was basically
trying to compare
the man made artifacts against the atmospheric noise. The level
of these noise artifacts did not seem lower on the loop.
The atmospheric noise on the loop was about 20 dB below that from
the dipole (as expected). But, in both cases, the atmospheric noise easily
covered the receiver noise.
One further test was to retune the loop to the phone band
and listen to two
local SSB stations, KC7WW and W7SZ. Both of these stations
are located in directions
favored by the dipole. They reduced power to behave like
weak stations and subjective measurements again clearly favored
the dipole.
The broad sweeping conclusion is that this horizontal loop is not
beneficial for me.
Many thanks to all the stations that provided signals. Some
got on 80-m WSPR to aid this experiment, and other run on a regular basis,
helping all the time. All are appreciated, and again WSPR has
proven to be a most useful tool for antenna evealuation. --Bob, W7PUA
This page was last updated 2 October 2013, W7PUA
Please email comments or corrections to bob 'the at
sign' janbob dot com
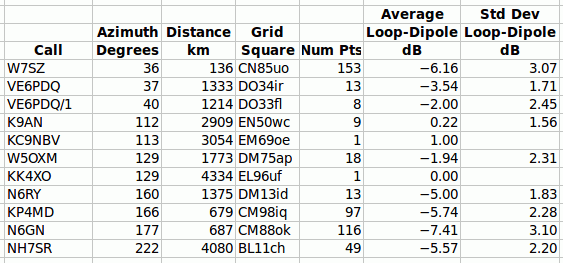
 The chart on the left summarizes the observations. The important column
is the "Average Loop-Dipole dB" which is positive if the loop out-performs
the dipole, and negative if the dipole performs best. The loop should
be omni-directional, but the dipole has poor reception
off the ends of the wire. For this reason the azimuth angle of
the transmitting station is the important independent parameter,
and is shown in the second column. The "Std Dev Loop-Dipole dB" is the
dB standard deviation of the unaveraged differences,
that gives some feel as to the spread in multiple
data points. Low values would suggest greater accuracy to the data.
Also important for data accuracy is the number of points,
as the final measurement standard deviation is roughly the value shown,
divided by the square root of the number of points.
 Now, on the left we have a graph of the dB differences plotted
against the azimuth angle of arrival. True north is zero degrees.
Each blue diamond corresponds to one of the eleven stations
in the chart. The
red letters "N" at the top of the graph correspond to the angles
where the dipole tends to null. Similarly, the red letters "P"
at the bottom correspond to angles where there are peaks in the dipole
pattern. The P and N symbols are not data points.