The resulting curve tended to follow the expected function of resistance being proportional to the speed of the boat squared. A typical point along this line is 22 pounds of resistance at 4-kt speed. This curve can be used to make estimates, such as the speed that electric drives might provide, or the force being provided by a sail combination.
Measurements were also made with the outboard motor down and the centerboard raised. This allows the fraction of the total resistance associated with these components to be determined.
THE FULL STORY - John and I arrived at Fern Ridge, Monday July 22, 2013,
to find a pretty good
breeze coming out of the Northeast. Boat resistance measurements are
affected by the wind, and being new to this measurement, we wanted to
measure in reasonably still air. We both had Tuesday available, so when
John volunteered to get up at 5 AM to find still air, we had a plan. I
was going to spend the night at the lake anyway.
The experiment - At 6 AM on Tuesday, Fern Ridge was glassy.
The breeze was building up some by
8AM, but this gave us the window we needed. John put his Redwing 18,
"Lazy Jack," into the lake and we connected a 100-ft 1/4-inch polypropylene
line from his boat back to the bow eye on the Birdwatcher-II. At the
towing end, a 50-lb fish scale was put into the line. John could read
both the scales and his GPS from the helm of his boat.
We went out into the lake, and John would set various speeds on the
outboard. He would record the speed and
the reading on the fish scale. All I had to do was to steer my boat to
follow directly behind John. We ended up getting measurements between
2 and 5.5-kts. The hull speed for the Birdwatcher is around 6-kts.
The paths of the boats were straight lines to minimize resistance due
to lateral movement. In all cases, the boat speed was left at a constant
value long enough for transient forces to die out. This could be
determined by
the speed reaching its highest non-varying value.
The polypropylene line was light enough to easily keep it out of
the water. In addition, when we would stop, it floated, keeping it away
from the outboard propeller. Polypropylene has low stretch, minimizing
springy line issues.
The first, and largest set of measurements was done with the Birdwatcher
motor out of the water, but with the center board fully down. Following this,
we made a few measurements with the motor down, and with the center board up.
The utility of these added measurements will be explained later.
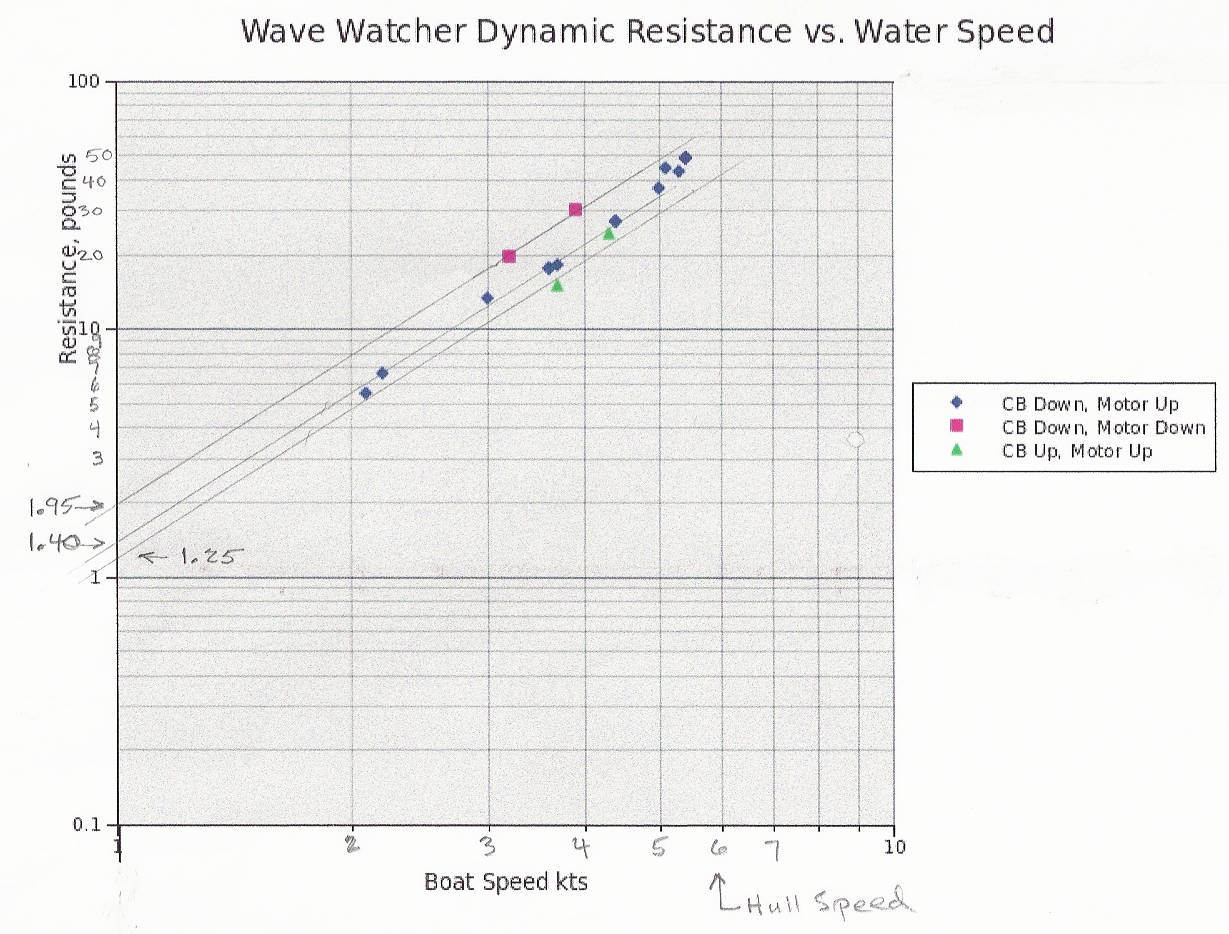
Looking at the data - The plot just above shows the towing force,
on the vertical axis, for
various GPS speeds, on the horizontal axis. The only thing causing the towing
force is the resistance of Wave Watcher. So we label the axis as boat
resistance. The fish scales limit the measurements to 50-lb.
The blue data points, for the
center board (CB) down and the motor up, are the
base case and were taken multiple times. Roughly, the towing force
ranged from around 6-lb at just over 2-kt to 50 lb at 5.5-kt.
It goes up a lot! Ignoring the red and
green points for now, the pencil line was drawn to center
the blue points at speed below about 5-kts. In addition, both the
horizontal and vertical axes have the same unequal spacing of the grid lines.
The spacing used here is called log-log and is chosen to cause
data points to appear on straight lines for the case of functions
of the form "force equals a constant number times
speed raised to some power." So, what does that mean? The physics of boat resistance has been
shown to be caused by
friction, when the boat is moving well below hull speed. This is mostly
friction in the water, but also can be friction in the air. We are using
the term "friction" in a general sense to include the effects of turbulence along the
surface along with the rubbing against the boat surface. We exclude the
force required to lift the boat up the bow wave, an effect that that appears
at higher speeds. Friction forces
will follow the special cases of straight lines on our log-log plot. This
corresponds to the force being equal to a constant number times the speed raised
to the power of about two, i.e., the speed squared. This squared relationship
for friction forces is extremely important in everything from vehicle
design to weather forecasting. But for our purposes, it allows us to
easily analyze the boat speed with a minimum of data.
Now we need to find the slope of a line for a squared function.
If we draw a straight line from point (speed=1, resistance=1) to the point
(speed=10, resistance=100), all points along that line
will follow a squared relationship. In addition, every line that follows
any other squared relationship will be parallel to the line we just drew,
but shifted up or down.
So, if we assume our resistance curve is dominated by
friction, as it should be for low speeds, we need only determine the
constant number. For this, we can extend the straight line to cover the
the speed of 1-kt. At that speed, one squared is still one, and so the force
value will be the constant. This is shown on the graph, where for the
blue-point curve, the constant is 1.4. The units of this constant are
pounds per knot-squared.
Now is a good time to review the data plot and lines to see if we
are being open-minded and objective. The reason being that we have constrained
the problem by using a straight line on the log-log plot,
and also forced this to have a slope of 2. Looking at the blue
data points at speeds of 5-kt or less, it seem as though they scatter
quite evenly about the center line. There is some noise in the data
which is not surprising considering the nature of pulling a boat
around the lake. This tracking of the line contrasts with the three
blue data points at
speeds above 5-kts, or maybe even the 5-kt point, where the resistance
seems to be moving above the speed-squared line. Thus, the assumptions of the
equation form of the line seem to be supported by the experimental data,
for speeds below about 5-kts.
At this point, we have measured the resistance of the hull at slow speeds
to be described by "1.4 times the boat speed squared." At speeds above 5-kt
or so, it appears the data points are moving higher than this curve. This
is expected, as the bow wave effect is becoming significant. To really see
this effect would require an all around bigger setup than we were using.
More pulling horsepower along with bigger rope and scales would be needed.
We will leave this for another experiment.
Looking at the slow speed end for a moment,
the people that study fluid flow have
found special cases to occur at very slow speeds. These are associated
non-turbulent flow around surfaces. I suggest we ignore these issues, since
the operation of boats at very slow speeds, i.e., without "way," are
just not important. The measurements here start at 2-kts and go up,
probably not including the slow cases.
Other Boat Configurations -
At first, we kept the configuration of the towed boat (the Birdwatcher)
as constant as possible. This gives us a base curve to
compare against. Next we changed configuration elements one at a tme
while continuing at moderate speeds.
We first lowered the 2-HP Honda motor into the water,
in its normal position. The motor was not running, but at around 2-kts
it started to turn with an obvious noise (as happens when sailing with
the motor down). The graph shows two red data points taken with the motor
down. Also, a pencil line, with a slope of two, was placed through these points.
This is, merely
saying that we assume the slope is still some friction curve. Extending the curve down
to 1-kt shows the constant to now be 1.95 lbs per knot-squared. This tells
us that the boat resistance increases by 100 x (1.95-1.40)/1.40 = 39%
when the motor is being dragged along. To me, this is surprisingly high.
But, it shows why these measurements can be very useful.
Next, the motor was raised out of the water as in the base case, and
then the centerboard was raised. The green markers show these two
resistance measurements. The resulting constant drops some to 1.25
lb/kt-sq, a drop of about 11% from the blue data line. The most
obvious change is the decrease in wetted surface for the boat, so
we can explore that here. The wetted surface for the boat
is roughly 80 square feet, with the board down. By itself, the board
has a wetted area of about 12 square feet. The decrease in wetted area
from raising the board is 15%, in rough agreement with the measured 11%
change in resistance.
Thoughts - This has been rewarding as an experiment. This
sort of activity is useful for organizing thoughts and for seeing what
study and further experiments are needed. But, this is the report of an
experiment, rather than of a study. I encourage others to conduct their
own experiments and to post the results. From this collective study
we can all gain knowledge. From knowledge comes not just satisfaction,
but also better boat construction and operation!
Special thanks to John for sacrificing his sleep and running
"Lazy Jack" so skillfully (at such an early hour!)
References - The study of resistance to movement in fluids has
gone on for many years. A couple of Web places to get more information are:
The
Wikipedia article on Drag Forces has information on the physics
of objects moving through fluids.
John Winters has extensively studied canoe and kayak hulls. information
is available at his
web site on frictional resistance, along with
residual resistance.
Examples of the Winters modelling appear most months in the Sea Kayaker
magazine reviews of kayaks.
This page was last updated 30 July 2013 & boat name correction 10-2017. Copyright 2013, 2017, Bob Larkin.
Please email comments or corrections to bob 'the at
sign' janbob dot com